Inspiration
The final design took some inspiration from our 2024 project, which utilized both a DNA aptazyme and a toe-mediated strand displacement (TMSD) system. We wanted to keep these aspects due to familiarity, though some modifications to the actual signalling output were made. Instead of using dye as the visual indicator, which was released into the buffer solution following the binding of the aptazyme with its target molecule, we wanted to explore the use of a newer and more novel method. Based on the literature we reviewed, we eventually settled on using a colorimetric enzyme system, which produces a visual colour change as a result of substrate cleavage [1].
The mechanism and components for the colorimetric enzyme system would be similar to the usual activity assay that is used to measure enzyme activity based on the observed absorbance. We began by looking at the classic beta-galactosidase/ONPG assay, where the enzyme, beta-galactosidase, would hydrolyze the substrate ONPG, converting it into galactose and o-nitrophenol; o-nitrophenol would be the product of interest as it gives off a yellowish hue in solution [2]. We planned to utilize this concept for our project with the same components.
However, there were several problems with this approach; the primary concern was the size of beta galactosidase (Figure 1), which would theoretically prevent it from binding to the aptazyme and undergoing the proposed mechanism (more on this later). Therefore, we did some research and stumbled upon another enzyme, horseradish peroxidase, or HRP, and its respective substrate, 3,3’,5,5’ -Tetramethylbenzidine, or TMB [3]. The major advantage of HRP when compared to beta-galactosidase is that it is significantly smaller, reducing the potential effects of steric hindrance. However, a limitation of the HRP-TMB system is that it requires a hydrogen peroxide-based medium to function, which leads to other complications due to the presence of free hydroxyl radicals, therefore we revised our procedure to address these issues.
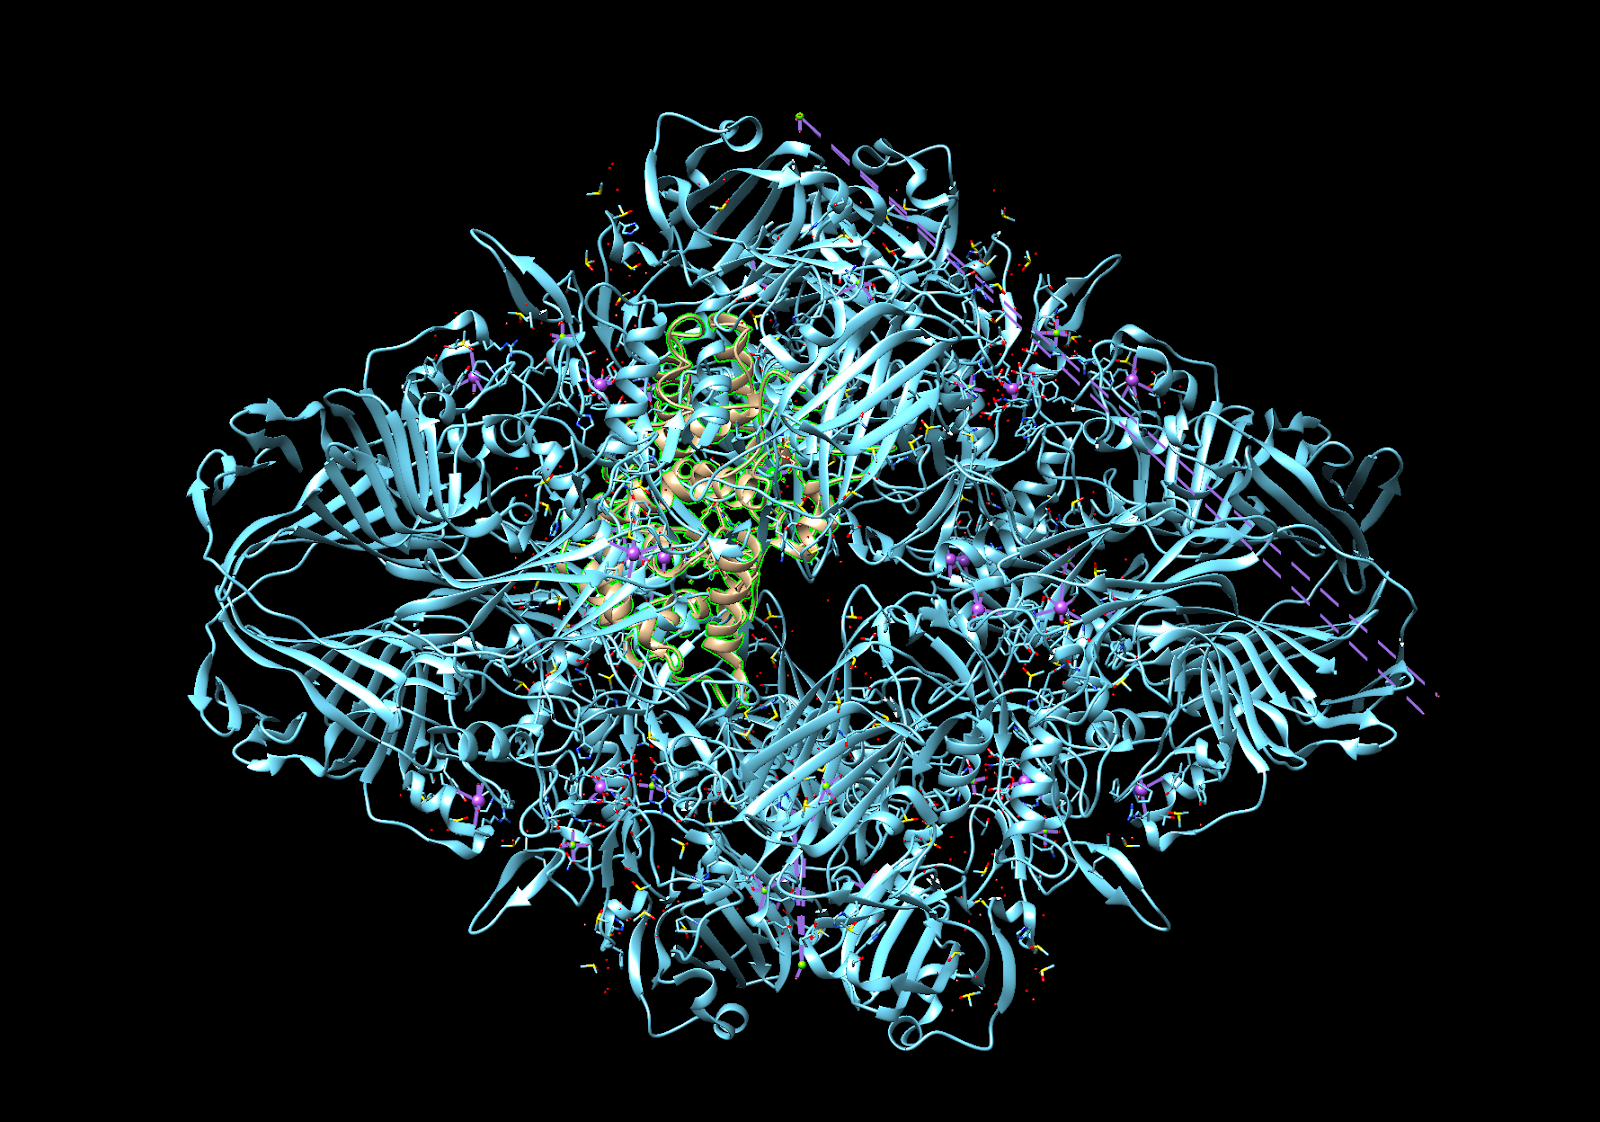
Figure 1. Size comparison between E.coli beta-galactosidase (blue) and horseradish peroxidase (green highlight). Done in Chimera.
Detection Mechanism
Our proposed mechanism is detailed below in Figure 2. The mechanism involves the target molecule being detected by a DNA aptamer, which leads to a conformational change, forcing the enzyme and substrate together and allowing the enzyme to cleave it. When enough substrate is cleaved, it will display a visual indicator in the form of a blueish hue in the solution. There will be a complementary TMSD system that will allow the insertion of a new aptamer for resetting the sensor.
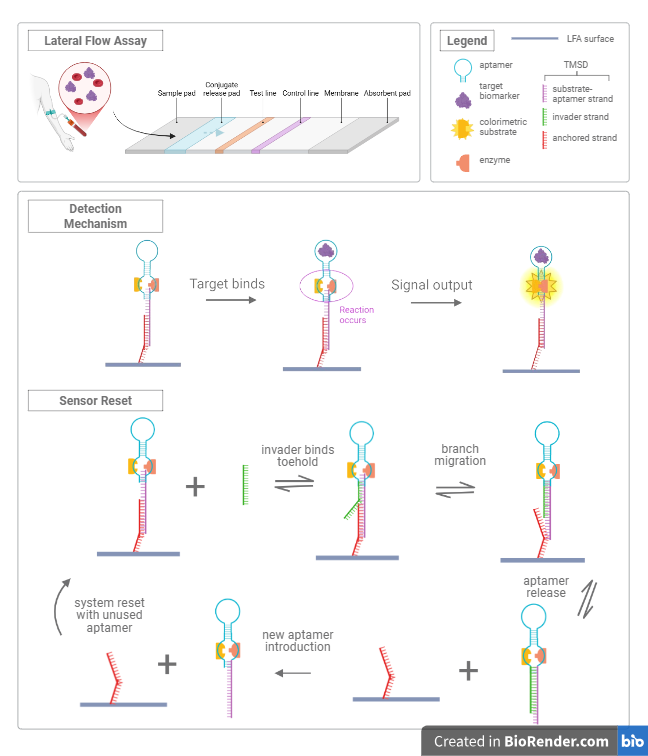
Figure 2. Overview of the detection mechanism and integration within the sensor design.
Modelling Introduction
Now that we had the pieces in play, we needed to verify whether or not a mechanism like this would actually work under molecular conditions. We started with modelling each component in Chimera and ChimeraX, such as the aptamers and the target proteins. We began by looking at both beta galactosidase and horseradish peroxidase and identified key structures (i.e, ion binding sites, important secondary structures, how it folds, etc.). We also compared them side by side as well as with other similarly sized molecules (Figure 3). By this time, we identified our respective target proteins, being p-tau181, p-tau231, and Aβ42 peptides. However, we ultimately chose to use Aβ42 over p-tau181 and p-tau231 due to it being a simpler peptide when compared to tau. Tau, as a peptide, is relatively large and disordered, making it difficult to 3D model and dock against its ligands. A complete model of tau does not exist on the Protein Data Bank and only certain portions of the protein can be shown at a time.
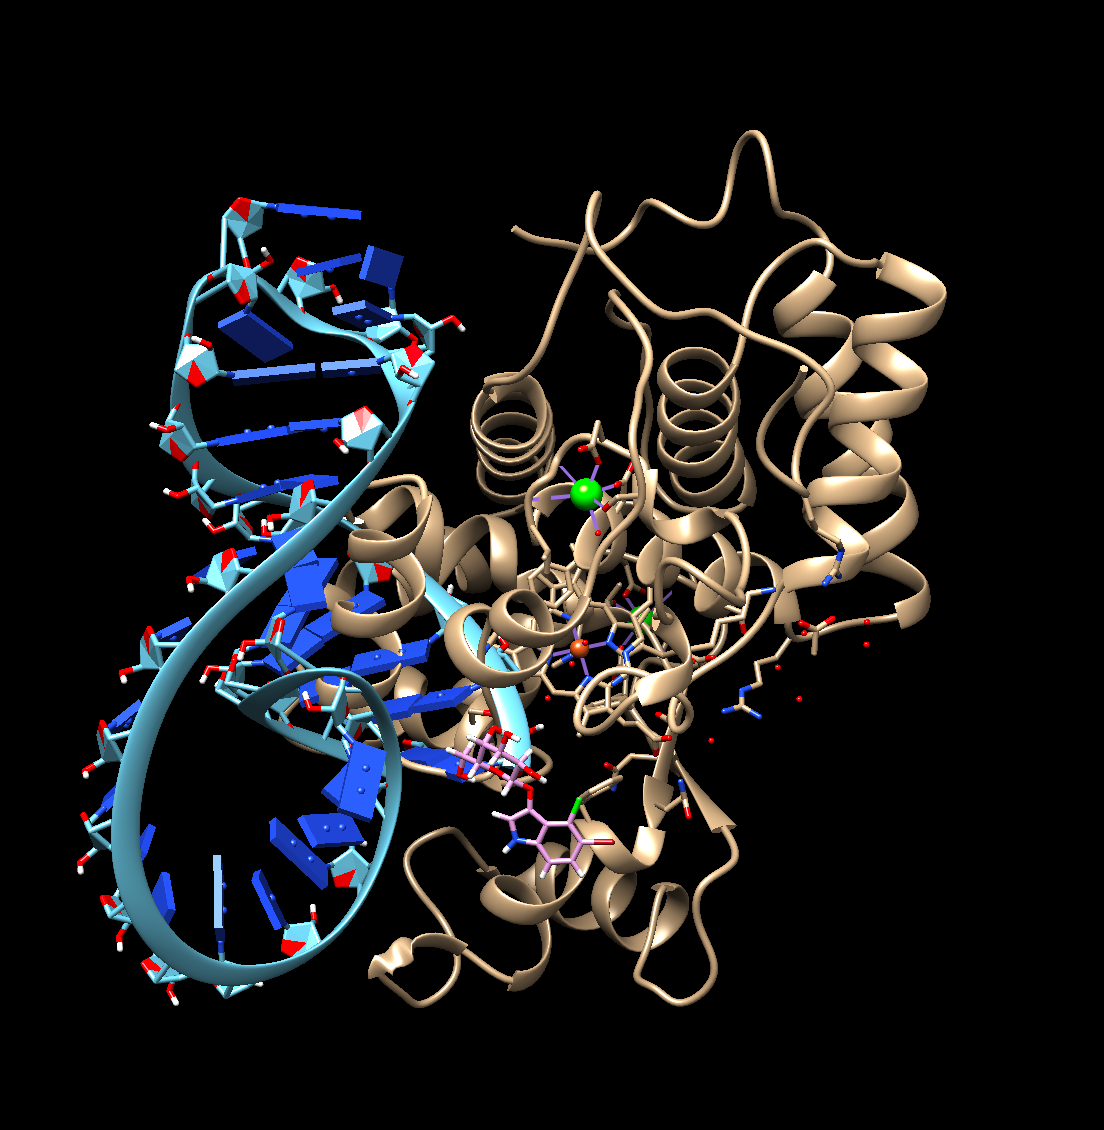
Figure 3. Horseradish peroxidase in comparison with the p-tau231 aptamer and substrate 5-bromo-4-chloro-3-indolyl-β-d-galactopyranoside, X-gal. Done in Chimera.
We also investigated attachment methods of the enzyme to the DNA aptamer via click chemistry, such as using a copper (I) catalyzed azide-alkyne cycloaddition reaction involving modified alkynyl nucleotides. However, this method was abandoned due to limited equipment and the complexity of successfully executing the reaction [4]. Therefore, we decided on using 5'-aminohexyl modified oligodeoxynucleotides to attach HRP to the aptamer.
Below is the molecular docking process for our three target molecules with their respective DNA aptamers. It will go over how we prepared the 3D structures (both the target and the receptor) for docking and the specific website that we used to execute the task.
Modelling Process for Aβ42, p-tau181, and p-tau231
-
Preparation of 3D Protein Structures:
Target molecules were either downloaded or created manually:
- The 3D structure for the Aβ42 peptide was obtained from the Protein Data Bank (PDB).
- The 3D structures for p-tau181 and p-tau231 were created by manually phosphorylating the tau protein at threonine 181 and threonine 231, respectively, using WinCoot Ver 0.9.8.7.
-
Preparation of Aptamer Structures:
Aptamer sequences were generated using Chimera. The steps were:
- Navigate to the 'Build' option in the top menu and select 'Build Structure'.
- Ensure 'helical DNA/RNA' is selected.
- Enter the aptamer sequence exactly as reported in the literature.
-
Docking Process:
Docking was performed using HDOCK. Key details:
- The aptamers were defined as the ligand while the target molecules (p-tau181, p-tau231, and the Aβ42 peptide) were defined as the receptor.
- Three docking requests were submitted, one for each target molecule.
- The top 10 docking models for each target were obtained and saved for further analysis.
Docking Results
We have included a section below detailing the qualitative and quantitative results after the docking process. Three figures are provided, which show the most ideal docking conformation for each target molecule and its respective DNA aptamer. There are also three tables given, which display quantities including docking scores, confidence scores, electrostatic interactions, ligand RMSD’s, etc.
Figure 4. Top docking result of Aβ42 with its aptamer. Done in HDOCK.
Table 1. Binding energies resulting from the docking of Aβ42 with its respective aptamer.
| Rank | Conf # | Electrostatics | Desolvation | VdW | Overall |
|---|---|---|---|---|---|
| 1 | 6621 | -41.769 | 11.176 | 14.782 | -40.291 |
| 2 | 6644 | -40.846 | 13.774 | 17.150 | -39.131 |
| 3 | 705 | -41.094 | 13.271 | 28.358 | -38.258 |
| 4 | 3059 | -41.857 | 12.798 | 37.450 | -38.112 |
| 5 | 9355 | -42.769 | 11.092 | 54.617 | -37.307 |
| 6 | 723 | -39.926 | 13.202 | 31.638 | -36.762 |
| 7 | 296 | -45.826 | 12.295 | 96.585 | -36.168 |
| 8 | 6018 | -39.741 | 13.244 | 37.269 | -36.014 |
| 9 | 116 | -43.876 | 13.501 | 81.298 | -35.746 |
| 10 | 1047 | -41.141 | 13.519 | 61.826 | -34.958 |
The binding energies reported from the docking software (Table 1) do not represent the binding affinity of the molecules. Rather, they are the scoring of each binding conformation, which is determined by the electrostatic interaction energy, desolvation, and Van der Waals interactions. The overall score indicates the strength of the binding, with more negative values indicating stronger binding. Electrostatic interactions result from charged molecules interacting with one another. Desolvation estimates the change in solvation free energy when the molecules come together and bury previously exposed polar or non-polar surfaces. Van der Waals (VdW) energy is the energy of interactions between molecules.
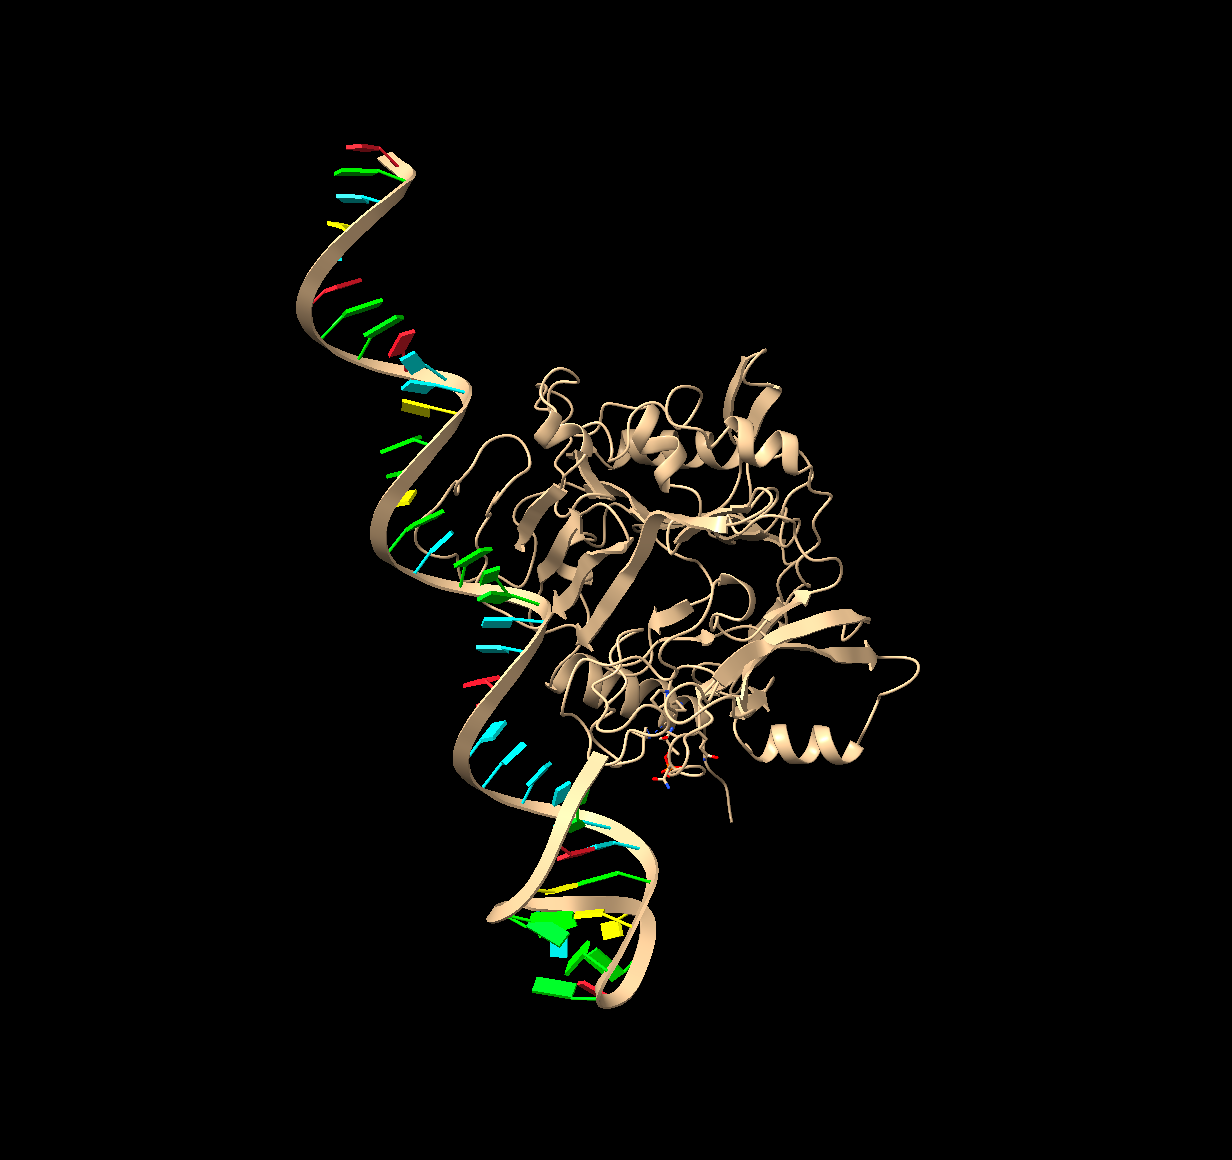
Figure 5. Top molecular docking result of p-tau181 with its respective aptamer. Done in HDOCK.
Table 2. Docking score, confidence score and ligand RMSD for the first ten models of docking between ptau-181 and its respective aptamer.
| Rank | Docking Score | Confidence Score | Ligand RMSD (Å) |
|---|---|---|---|
| 1 | -256.13 | 0.8931 | 95.17 |
| 2 | -241.27 | 0.8612 | 88.57 |
| 3 | -240.77 | 0.8600 | 92.74 |
| 4 | -235.13 | 0.8459 | 102.36 |
| 5 | -234.52 | 0.8443 | 91.72 |
| 6 | -231.82 | 0.8370 | 98.11 |
| 7 | 231.13 | 0.8352 | 93.72 |
| 8 | -229.55 | 0.8308 | 98.93 |
| 9 | -228.87 | 0.8288 | 97.75 |
| 10 | -227.03 | 0.8236 | 97.65 |
The docking score is a quantitative measure that represents both the stability and strength of molecular interactions between the receptor and the ligand. Stronger binding interactions and higher potential effectiveness are represented by a lower score that is usually negative [5]. The confidence score is a representation of certainty; it ranges from 0 to 1, with values closer to 1 being of a higher certainty, while values closer to 0 are of a lower certainty. The Ligand RMSD (root mean square deviation) measured in Å is used to evaluate predicted structures against experimentally solved ones; models that have a score within 2Å indicate successful docking, while scores above 3Å are considered unsuccessful [6].
For these ten models of p-tau181 with its respective aptamer, although the docking score is low with a relatively high confidence interval, the ligand RMSD is greater than 3Å, suggesting that these docking simulations were not successful.
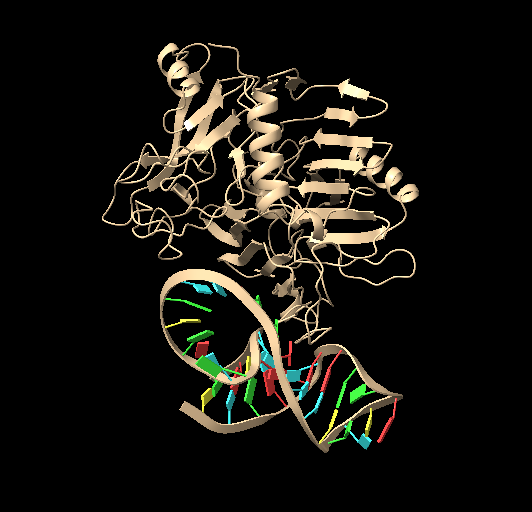
Figure 6. Top molecular docking result of p-tau231 with its respective aptamer. Done in HDOCK.
Table 3. Docking score, confidence score and ligand RMSD for the first ten models of docking between ptau-231 and its respective aptamer.
| Rank | Docking Score | Confidence Score | Ligand RMSD (Å) |
|---|---|---|---|
| 1 | -278.99 | 0.9296 | 37.59 |
| 2 | -270.36 | 0.9174 | 52.72 |
| 3 | -263.76 | 0.9068 | 42.34 |
| 4 | -254.76 | 0.8904 | 38.18 |
| 5 | -254.08 | 0.8891 | 43.33 |
| 6 | -254.08 | 0.8891 | 55.25 |
| 7 | -247.22 | 0.8748 | 52.94 |
| 8 | -246.73 | 0.8738 | 43.65 |
| 9 | -242.22 | 0.8635 | 52.19 |
| 10 | -238.81 | 0.8552 | 47.04 |
A similar trend for p-tau231 is seen, although the docking score for each model is lower with higher confidence scores. However, the ligand RMSD is still greater than 3Å, indicating that docking simulations were not successful.
Note that the ligand RMSD for model 1 of p-tau231 is considerably lower than model 1 for p-tau181 (37.59 Å compared to 95.17 Å), suggesting that p-tau231 had a higher docking success rate.
References
- [1] D. Wu, T. Gao, L. Lei, D. Yang, X. Mao, and G. Li. “Colorimetric detection of proteins based on target-induced activation of aptazyme.” Analytica Chimica Acta, vol. 942, pp. 68–73, Sep. 2016. doi: 10.1016/j.aca.2016.09.010 .
- [2] A. Gilchrist and J. Nobbs. “Colorimetry, theory.” In Elsevier eBooks, 2016, pp. 328–333. doi: 10.1016/b978-0-12-803224-4.00124-2 .
- [3] L. S. A. Busa et al. “3,3′,5,5′-Tetramethylbenzidine oxidation on paper devices for horseradish peroxidase-based assays.” Analytical Sciences, vol. 32, no. 8, pp. 815–818, Aug. 2016. doi: 10.2116/analsci.32.815 .
- [4] R. A. Decréau, J. P. Collman, and A. Hosseini. “Electrochemical applications. How click chemistry brought biomimetic models to the next level: electrocatalysis under controlled rate of electron transfer.” Chemical Society Reviews, vol. 39, no. 4, pp. 1291–1291, Jan. 2010. doi: https://doi.org/10.1039/b901972n .
- [5] A. Shirali, V. Stebliankin, U. Karki, J. Shi, P. Chapagain, and G. Narasimhan. “A comprehensive survey of scoring functions for protein docking models.” BMC Bioinformatics, vol. 26, no. 1, Jan. 2025. doi: https://doi.org/10.1186/s12859-024-05991-4 .
- [6] Y. Ding, Y. Fang, J. Moreno, J. Ramanujam, M. Jarrell, and M. Brylinski. “Assessing the similarity of ligand binding conformations with the Contact Mode Score.” Computational Biology and Chemistry, vol. 64, pp. 403–413, Oct. 2016. doi: https://doi.org/10.1016/j.compbiolchem.2016.08.007 .